In Our Last Post, We Left a Question Unanswered
In a recent post, we showed how a utility connected Microsoft Copilot to Tavro’s MCP Server to track the real value of AI — mapped to business processes, with live financials and benefit realization across five high-priority use cases. Copilot found the answers in seconds. Executives could ask plain questions and get ranked, structured answers directly from Tavro.
But something was conspicuously missing from that story.
If the Application Portfolio Rationalization use case is worth a $5.24M net benefit over three years, and if AI agents are doing the scoring, the duplicate detection, the retirement candidate flagging — what is the data that powers all of that actually worth?
Most data strategies can’t answer that question. They talk about data quality, data governance, data literacy. What they rarely do is put a dollar figure on the data itself, anchored to a specific AI use case and a real business case.
Here’s what this utility did instead.
The Problem with Data Strategy as Usually Practiced
Data strategy has a credibility problem.
It generates frameworks, taxonomies, and governance councils. It produces data dictionaries that no one reads and data quality scorecards that no one acts on. And when a CFO asks, “What are we getting for our data investment?” — the honest answer, far too often, is: “We can’t tell you.”
The utility took a different approach. Rather than building a data strategy in the abstract, they grounded it in something concrete: a fully modeled AI use case with a validated business case. And they used that business case as the anchor to work backwards — to identify the data assets that make the AI possible, and to assign each one a dollar value.
They called these assets their Data Crown Jewels.
The Methodology: Four Steps from AI Value to Data Value
The framework is straightforward and repeatable. Any organization with a modeled AI use case in Tavro can run this analysis.
Step 1 — Anchor to the 3-Year Net Benefit of the AI Use Case
The Application Portfolio Rationalization use case had a fully modeled business case in Tavro: a 3-year net benefit of $5,240,002, a 3-year ROI of 187 percent, and a payback period of roughly 18–20 months. That number became the anchor for everything that followed.
Step 2 — Allocate 20% of That Value to Data Crown Jewels in Aggregate
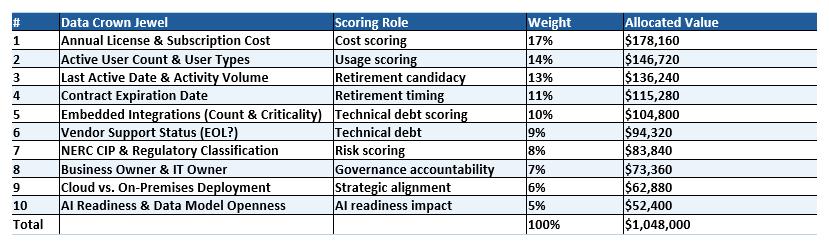
Drawing on the EDM Council’s Data Office ROI Playbook, the utility assigned 20 percent of the 3-year net benefit — $1,048,000 — as the value attributable to data. The rationale: without accurate, complete metadata, the AI agents cannot score retirement candidacy, detect duplicates, or flag governance risk. The data is load-bearing.
Step 3 — Distribute That Value Across the 10 Crown Jewels by Causal Impact
The utility’s application scoring model runs on 10 metadata dimensions. Each dimension was assigned a weight based on its direct causal impact on the four financial value drivers: application retirement savings, IT FTE redeployment, API/middleware consolidation, and governance gate (avoided future spend).
Step 4 — Produce Action Plans for Each Crown Jewel
For each data asset, the utility documented why it matters, what the risks are if the data is missing or stale, and a concrete remediation plan — tied to specific systems, timelines, and ownership.
What the Top Three Crown Jewels Tell You
The three highest-value dimensions — Annual License Cost, Active User Count, and Last Active Date — together account for 44% of the total data value pool, or $461,120. That concentration is not an accident. These are the dimensions most directly tied to the retirement scoring model’s financial outputs.
Annual License & Subscription Cost ($178,160) is the single most direct input to the retirement savings calculation. Every retired application’s savings estimate starts here. Missing or stale cost data deflates the business case and mis-ranks candidates. For this utility, licenses were often embedded in enterprise agreements, making per-application cost extraction non-trivial — but non-negotiable.
Active User Count & User Types ($146,720) determines whether an application is actively serving business value or has become a zombie system. The risk: user counts are frequently self-reported or pulled from Active Directory groups that haven’t been cleaned in years, overstating adoption and masking retirement candidates.
Last Active Date & Activity Volume ($136,240) is the strongest single indicator of retirement candidacy. An application with no activity in 6–12 months is a retirement candidate regardless of cost. But for this utility, OT/SCADA systems required a special override: low IT-side activity does not mean operationally dispensable. NERC CIP classification became the guard rail.
What the Utility Did with the Analysis
The report became an immediate operational roadmap. The three highest-value dimensions were designated as the first targets of a metadata collection sprint ahead of the CIO rationalization workshop.
Concretely, that meant:
- Extracting current license and subscription costs from Oracle ERP and procurement records for all 151 applications
- Pulling active user counts from IAM/Active Directory and cross-referencing against SSO login telemetry to validate actual activity
- Harvesting contract expiration dates and flagging all applications with contracts expiring within 12 months as Priority Retirement Candidates
The utility also flagged the structural risk plainly: $1,048,000 in attributed data value is only realized if the 10 metadata dimensions are complete, accurate, and continuously refreshed. A data quality gap isn’t an abstract governance concern. It’s a financial exposure with a number on it.